The one that explains how much sugar is actually healthy for your child
How much sugar should healthy children be eating each day?
If you are looking for daily sugar intake guidelines for children by age...
Then just scroll to the bottom of this post and you will find them there, summarised in easy to understand graphics.
Beware before you read on. This is not an exciting blog post. This is a boring but necessary blog post. This article explains how I have calculated my daily sugar intake guidelines by age. These are the guidelines that I use throughout my sugar gallery graphics. I therefore think it is very important that you can see the rationale behind my numbers.
I want to start by explaining that the sugar gallery is designed to be a quick visual reference library for parents. Therefore to keep it quick, simple and easy to interpret I have simplified my calculations and guidelines so that it is easy to understand. I will now take you through the steps I took to create what I think are robust but practical and sensible graphics.
World Health Organisation Guideline For Children's Sugar Intake
I started with The WHO guideline for sugar intake. The WHO is quite clear in the amount of sugar they recommend adults and children should be eating.
- All adults and children should reduce their total intake of free sugars to less than 10% of total energy intake.
- A further reduction of free sugars to 5% of total energy intake could be even more beneficial
- The WHO guidelines only relate to what they define as 'Free Sugars'
"all monosaccharides and disaccharides added to foods by the manufacturer, cook, or consumer, plus sugars naturally present in honey, syrups, and fruit juices"
- Fresh fruit and the naturally occurring sugars in dairy products (lactose) do not fall into these guidelines.
Based on these statements I have created the following system.
- > 10% is too much RED SPOON
- < 5% is perfect GREEN SPOON
- 5 - 10 % is not as good as <5% ORANGE SPOON
So that was that sorted, I mean how easy is that right? We can all follow that with out any problems what so ever? Well actually I still think this is a bit tricky. I mean what does 5% of a kids energy intake look like.
Energy Intakes For Children
So next, I determined the energy intakes for kids. This is where I took a few liberties that I will explain my reasonings for. As I mentioned above, the point of the sugar gallery is to be a simple reference tool. When it comes to the recommendations for children's energy intakes it is actually not all that simple. Recommended energy intakes vary by age, gender, by weight and height and by physical activity level. I decided I needed to narrow these categories down otherwise there were just going to be too many numbers for people to look at, and the simplicity of the sugar gallery concept would go out the window.
So this is what I did.
- I decided to reduce the number of ages I cover. The gallery is just to give a quick snapshot therefore I don't think it requires all ages to be included. The ages I have selected to use are: 1 year, 2 years, 5 years, 10 years
- Although there are differences by gender I have decided to just stick to one number and not differentiate between the two. The differences are not huge (especially when you take weight into consideration) and as the general goal with sugar is to be eating less I have decided to use the average female energy intakes for my guidelines. These are slightly lower than the males. When it comes to free/added suga,r eating slightly less than the WHO guidelines is fine, whilst eating above them is linked to poorer health outcomes.
- Height and weights; I decided just to use those already calculated within the Ministry of Health Nutrient Reference Values for Australia and New Zealand
- Physical Activity Level. There are a range of Physical Activity Level factors ranging from bed rest at 1.2, to vigorous activity at 2.2. I decided to use light at 1.6 for my calculations. Again because in the case of sugar it is better to be on the lower side than on the higher side.
Total Daily Energy Requirements For Children
This gave me the following total daily energy requirements taken from the Nutrient Reference Values for Australia and New Zealand
- 1 year: 3200 kJ
- 2 year: 4400 kJ
- 5 year: 5700 kJ
- 10 year: 7600 kJ
So that's much simpler isn't it? Now we have 4 numbers to deal with. I mean everyone totally knows what 3200 kJ looks like when it comes to food, and more importantly what that looks like when it comes to sugar? I think not, so I did a bit more work.
Added Sugar Guidelines For Children
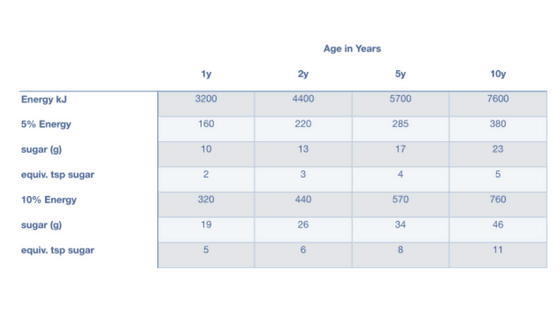
The next step was pretty simple I worked out what 5% and 10% of these energy totals, as these are the basis of the WHO guidelines. I then worked out what these were in grams of sugar. Every gram of carbohydrate provides 16.7 kJ of energy. So by dividing the energy by 16.7 I end up with the grams of sugar. It was then a case of converting this total grams of sugar to teaspoons of sugar. The numbers for all this are in the table below.
My calculations table
The Sugar Gallery Daily Sugar Intake Guidelines by Age
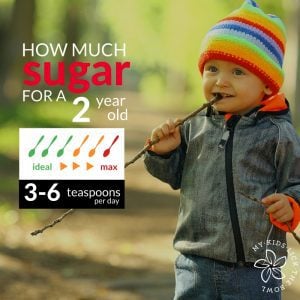
I then made my own graphics which summarise all this quickly and simply by age.
What do you think of these new graphics?





This is fantastic! Thank you so much for breaking it down by age, this is exactly what I've been looking for my wee ones aged 1 and 3.
Really like how your doing the new pictures! It makes life so simple!
Oh brilliant!! Glad you are finding it helpful!